On 13th Jan 2002 I monitored RAF VOLMET from Brampton on 5.450MHz USB from 0720 until 2100 (yes,continuously and I obviously need to get a life!). I did this on a low dipole (0.1 wavelengths above ground) in the hope of maximising any vertically received signals.
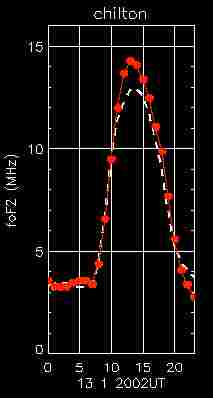
As with the RTTY test before, I have plotted Chilton’s FoF2 against signal strength received. The detailed Excel spreadsheet may be found here (use your browser back key to return to this page).
The graph of Chilton FoF2 for the day is shown below.
The results are very much more interesting than last time.
Only the basic results are shown. I did in fact make some very detailed notes and have come up with a table for trying to describe the state of the signal beyond the simple s-meter strength which, as you know, only tells part of the story. Here’s the key I used:
FADING PERIOD
The time it takes for the signal to drop into a trough, overpeak and then return to stable.
1 STABLE
2 FAST FLUTTER ( <3 minutes period)
3 3 minutes
4 10 minutes
5 20 minutes or greater
FADING RANGE
The range from maximum to minimum signal reading during a single fading period.
A 6dB
B 12dB
C 18dB
D 22dB or greater
AUDIO QUALITY
An attempt to describe whether the audio is noticeably affected by multipath cancellation.
i. UNMODIFIED
ii. MODIFIED
As you can appreciate, it is very difficult to represent this amount of information clearly!
RESULTS
Well, it is clear that there is a marked effect on the signal strength at certain times.
What is most interesting is that the march of darkness from around 1600 DID NOT produce a noticeable effect on the signal. However, the rapid drop of the FoF2 past the “20% above frequency of interest” from about 1900 certainly did! Could this be that elusive NVIS effect?
I noticed several other very interesting traits of the signal around the time that the signal rapidly fell. It seemed to exhibit ‘pings’ for want of a better expression. In other words, there would be very short bursts (less than one second in length) when the signal strength would leap by up to 12dB. These momentary effects occurred across the period when the signal was dropping most violently (1910-1950). Could this be the F2 layer dispersing so that occasionally it reflects and then doesn’t – something like looking up at the surface of the sea from below as it mills around?

